Hurricane Sandy

I began studying Hurricane Sandy’s winds after my retirement in early 2013, collaborating with Dave Robinson and Mat Gerbush at Rutgers University,  Pete Johnsen at Cray, Inc., Alan Norton at NCAR and, later, with Kun Gao at Princeton University’s GFDL. We used Rutgers University’s NJ Weather Network observations and data from the Weather Research and Forecasting (WRF) model to study the fine structure of winds during Sandy’s landfall on NJ.

Wind barbs show observed wind speed at NJ Weather Network stations and colors show WRF simulated wind speed at 3 hours before landfall time.

Colored surface shows top of high-speed winds as simulated by WRF model. Colors show that high-speed wind mostly occurred near the ground. Small piece of coastline in center is near landfall site of Atlantic City, NJ.

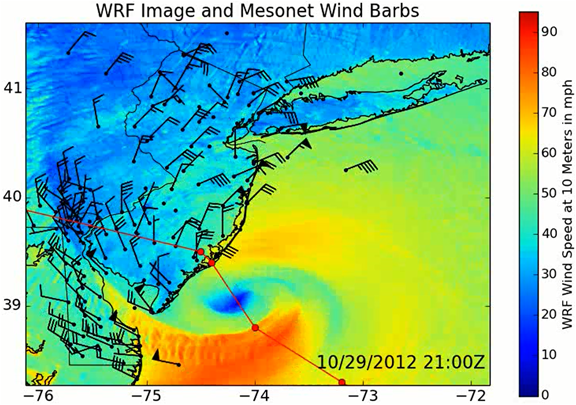
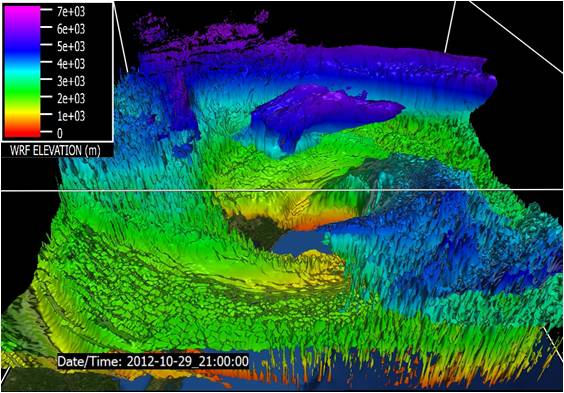
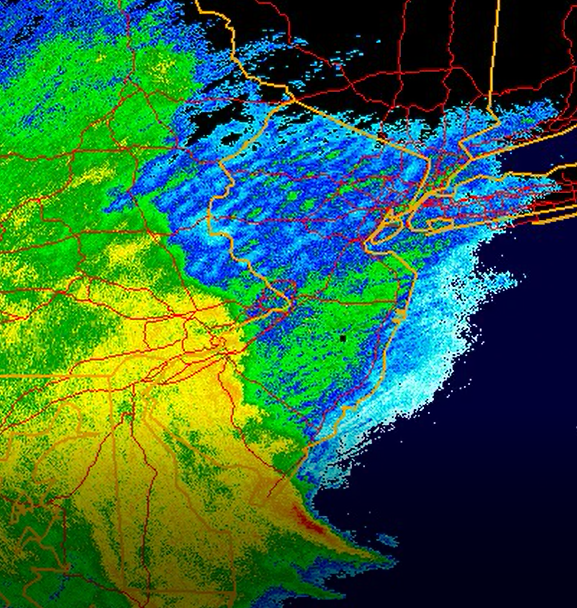
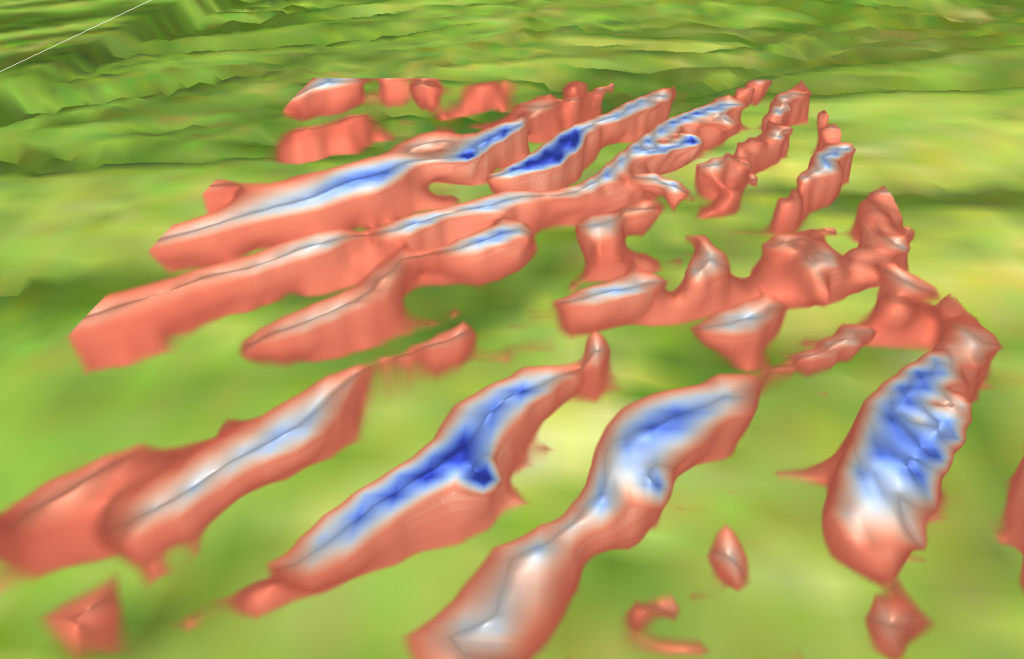
Hurricane Sandy’s New Jersey landfall on 29 October 2012 caused massive treefall that produced widespread, long-duration power outages throughout the landfall region. Using radar data and two independent types of models, we discovered that very large roll vortices, the largest ever reported, occurred in the lowest few kilometers of the troposphere over land during the landfall period. Roll vortices are helical flows that rotate on horizontal axes and lie next to each other near the ground, with adjacent rolls rotating in opposite directions. On the side of their downward motion, they transport higher-speed air to the ground, increasing the likelihood of damaging winds in localized ground-level streaks. Understanding their downward and upward air transport is also important for improving the accuracy of hurricane intensity forecasts.

Roll vortices as observed in radar over NJ and eastern PA.

Roll vortices as exhibited in WRF simulation near Reading, PA.